
The energy sector is the most significant contributor to greenhouse gas emissions in Mauritius, driven primarily by fossil fuel combustion for electricity generation, transportation, and industrial processes.
Energy (IPCC Sector 1)
 This includes all emissions from fuel combustion and fugitive emissions from fuels. | 1A Fuel Combustion Activities
1B Fugitive Emissions from Fuels
1C Carbon Dioxide Transport and Storage
|
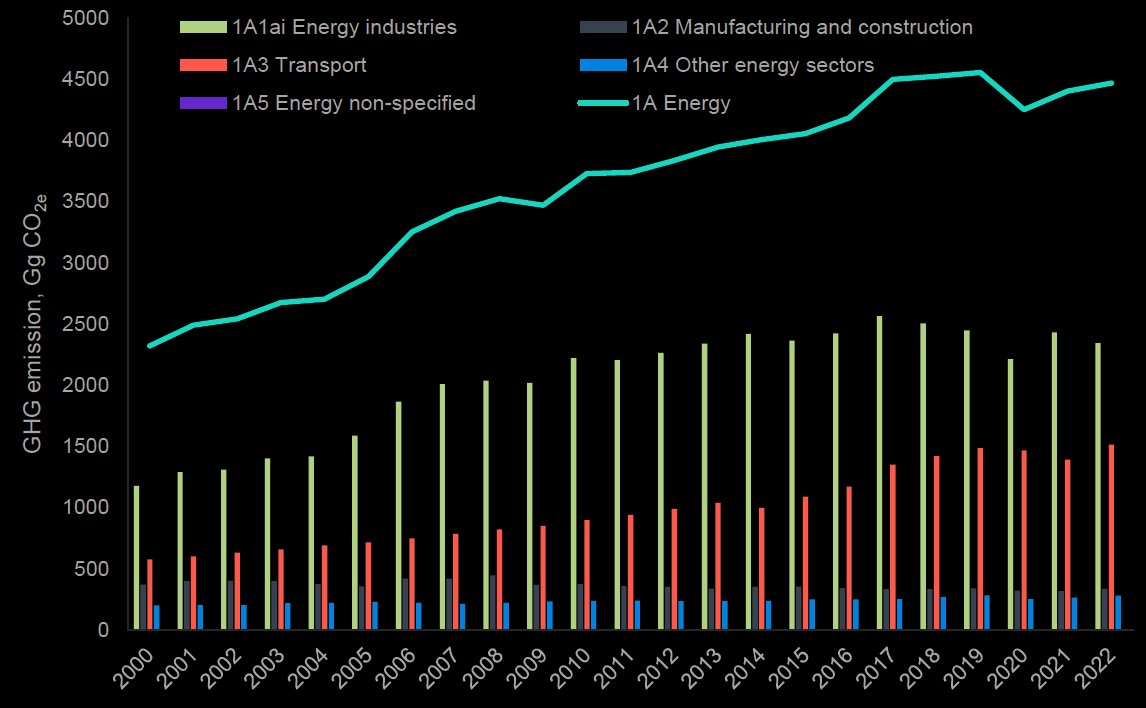
Overview of Emissions from the Energy SectorEmissions within the energy sector in the Republic of Mauritius stem solely from fuel combustion (1A). Fugitive emissions (1B), although smaller in scale, occur during the processing and distribution of fossil fuels, highlighting the challenges in managing emissions across the energy supply chain. The Energy sector consistently has the highest GHG emissions, with a generally stable trend showing minor fluctuations around 4,400 Gg CO2-eq since 2017. The stable yet high emissions indicate that the energy sector remains the dominant contributor to the country's overall emissions, largely due to the reliance on fossil fuels for energy production.
GHG emission trend of Energy sector of RoM from 2000 to 2022. source: BTR/NID 2024 | ||
|
| |
Source Description | |||||||||||||||||||||||||||||||||||||||||||||||
1A1 - Energy IndustriesEnergy Industries: Emissions from electricity generation and other energy-producing sectors. Fuel combustion activities dominate the energy sector landscape of the Republic of Mauritius (RoM), which, lacking natural energy resources, relies heavily on imported petroleum products to meet its energy needs, including electricity generation and transportation. Despite this dependency, the RoM has leveraged bagasse—a by-product of the sugar cane industry—as the primary local source of biomass energy. Additionally, hydroelectric power plays a significant role, with 10 hydro power plants across the island contributing a combined installed capacity of 59 MW, exploiting the island's hydro potential nearly to its fullest. Solar and wind energy are also part of the renewable energy mix, albeit to a lesser extent. The global uncertainties in fossil fuel prices and supply have prompted the RoM to prioritize energy security, particularly in electricity generation and transport. This has led to the development of policies and strategies that emphasize the potential of renewable energy sources and the promotion of energy efficiency, aligning with the Government’s objective of promoting sustainable development (Outline Energy Policy, 2007; Long Term Energy Strategy and Action Plan 2009-2025). The largest greenhouse gas emitter in Mauritius remains the Energy Industries sector, which primarily involves electricity production, accounting for 46.7% of total emissions. | |||||||||||||||||||||||||||||||||||||||||||||||
1A2 - Manufacturing Industries and ConstructionManufacturing and Construction: Emissions from fuel combustion in manufacturing industries. Emissions from manufacturing industries and construction remained stable from 2000 to 2022. The manufacturing and construction activities are part of the secondary sector of the country that contribute to the 20.7% of the total Global Value Added (GVA) of the country. The manufacturing category and its sub-categories, are the largest sector in Mauritian economy, contributing the 13.9% of the GVA of the country in 2016 (National Accounts and Investment, NAI 2016). The fuel types used in the manufacturing industry are mainly diesel, fuel oil, liquified petroleum gases (LPG), coal, gasoline, and biomass fuels such as fuelwood and bagasse. The GHG emissions provided from this category result from the combustion of these fossil fuels. | |||||||||||||||||||||||||||||||||||||||||||||||
1A3 - TransportTransport: Emissions from road transport, aviation, shipping, and railways. The transport sector, the second-largest emitter, includes civil aviation, road and light rail transport (introduced in 2019) and water-borne navigation. In 2022, road transport alone accounted for 93.4% of transport emissions. The transport sector consumed 47% of the country's total energy in 2021, amounting to 378 ktoe. This represents a slight decline from previous years, reflecting a broader trend of fluctuating energy use within the sector. Road and light rail transportation are the primary modes of land transport in Mauritius, catering to both passenger and freight needs. The mass transit system was introduced to improve public transportation infrastructure and reduce road congestion. The majority of the vehicles are passenger cars, making up over half of the total fleet, with motorcycles and autocycles following at over one-third of the total fleet. Vehicle registrations have continued to rise, reflecting increasing demand for personal and commercial transport. In air transport, Mauritius currently has over 20 scheduled airlines serving around 30 destinations from the international airport. The passenger terminal is nearing its operational capacity, handling nearly 1,640 passengers per hour and operating at 92% of its 4 million annual passenger capacity. Plans are in place to increase passenger capacity to 4.5 million and expand air freight traffic to 65,000 tonnes by 2025. Recent developments include a new Cargo, Freeport, and Logistics zone near the airport to support these growing demands. The maritime sector has also seen significant upgrades, with the extension of the Mauritius Container Terminal berths to 800 meters, making Port Louis the deepest port in the region. The port has enhanced its capacity to handle up to 750,000 TEUs, with increased bunker traffic by 36% over the past three years, and the number of cruise ships docking in Port Louis has risen from 24 to 37. These reflect the dynamic growth and ongoing development within Mauritius's transport sector as the country continues to enhance its infrastructure to meet rising demand and improve efficiency (Statistics Mauritius). |
| ||||||||||||||||||||||||||||||||||||||||||||||
1A4 - Other Sectors
| Air Mauritius's ground operations emissions, which increased by 163% since 2000, are categorized under 'Other Transportation'. | ||||||||||||||||||||||||||||||||||||||||||||||
National inventory of greenhouse gas emissions by sector, Republic of Mauritius (SM, 2022) | |||||||||||||||||||||||||||||||||||||||||||||||
Energy Industries | Manufacturing Industries | ||||||||||||||||||||||||||||||||||||||||||||||
Transport | Other Sectors | ||||||||||||||||||||||||||||||||||||||||||||||
National inventory of greenhouse gas emissions by GHG, Republic of Mauritius (SM, 2022) | |||||||||||||||||||||||||||||||||||||||||||||||
Carbon Dioxide - CO2 | Methane - CH4 | ||||||||||||||||||||||||||||||||||||||||||||||
Nitrous Oxide - N2O | Hydrofluorocarbon - HFC | ||||||||||||||||||||||||||||||||||||||||||||||
To mitigate these emissions, there is an increasing emphasis on transitioning to renewable energy sources, enhancing energy efficiency, and exploring alternative fuels for transport and industry.