The Industrial Processes and Product Use (IPPU) sector in Mauritius encompasses a range of activities that produce greenhouse gas emissions through chemical reactions, industrial manufacturing, and the use of products that release gases during their lifecycle.
Industrial Processes and Product Use (IPPU) (IPCC Sector 2)
 This covers emissions from industrial processes and the use of products that produce greenhouse gases.
Greenhouse gas emissions arise from a wide range of industrial activities, primarily through the chemical or physical transformation of materials during industrial processes. These processes can emit various greenhouse gases, including carbon dioxide (CO2), methane (CH4), nitrous oxide (N2O), hydrofluorocarbons (HFCs), perfluorocarbons (PFCs), and other fluorinated compounds like trifluoromethyl sulphur pentafluoride (SF5CF3). Additionally, greenhouse gases are often incorporated into products such as refrigerators, foams, and aerosol cans. For instance, HFCs are commonly used as substitutes for ozone-depleting substances (ODS) in many products. Similarly, sulphur hexafluoride (SF6) and N2O are utilized in various industrial and consumer products. | 2A Mineral Industry
2B Chemical Industry
2C Metal Industry
2D Non-Energy Products from Fuels and Solvent Use
2E Electronics Industry
|
Overview of Emissions from the IPPU Sector for Mauritius | ||
In the Republic of Mauritius (RoM), the primary emission sources within the Industrial Processes and Product Use (IPPU) sector are the use of products as substitutes for ozone-depleting substances (ODS) (90.7%) under category 2.F, followed by the metal industry (category 2.C), which includes iron and steel production and the manufacturing of construction iron and steel bars (6.9%). Non-energy products derived from fuels and solvent use (category 2.D) contribute 2.5% to the sector's emissions, while lime production accounted for 0.3% of emissions in 2014, with no emissions recorded in 2016.
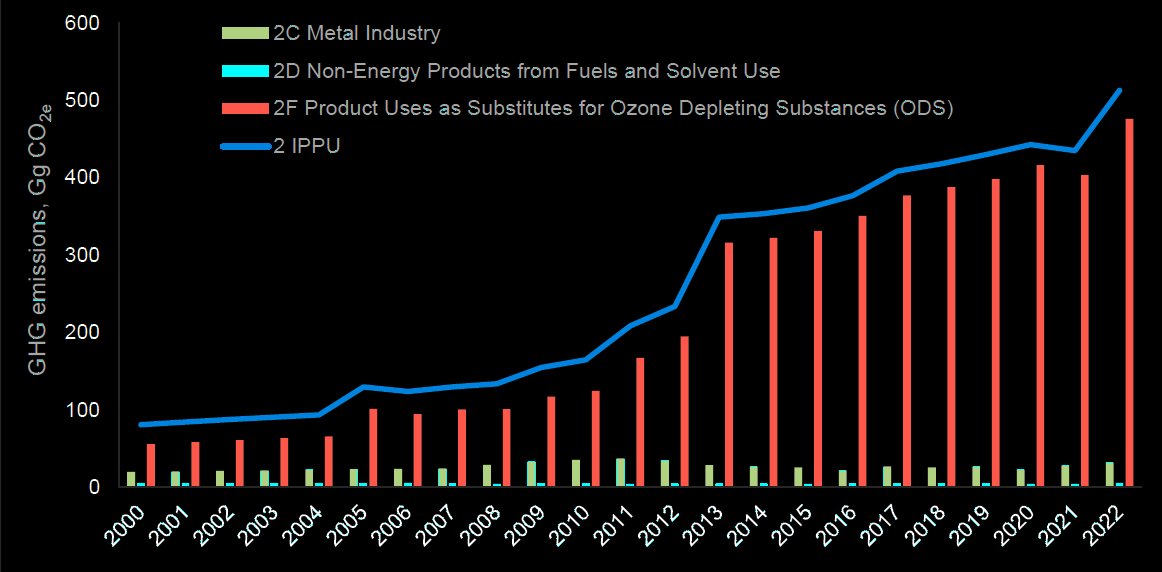
GHG emission trend of IPPU sector of RoM from 2000 to 2022. source: BTR/NID 2024 | ||
GHG trends in IPPU sector in RoM from 2000 to 2022 (by Category)From 2000 to 2022, GHG emissions from the IPPU Sector in Mauritius increased by 536%, from 81 Gg CO2e to 513 Gg CO2e. The predominant source of emissions within this sector is the use of products as substitutes for Ozone Depleting Substances (ODS) (category 2.F.1), specifically in ‘Refrigeration and Stationary Air Conditioning’ (category 2.F1.a ) and ‘Mobile Air Conditioning' (category 2.F1.b ), which together account for 92.8% of the sector's total emissions. Specifically, emissions from stationary air conditioning soared by 747% over this period. In 2022, the ‘Refrigeration and Stationary Air Conditioning’ category contributed 97.8% (466 Gg CO2e) of the emissions from this group, with the remaining 2.2% (10 Gg CO2e) coming from mobile air conditioning. Within the ‘Refrigeration and Stationary Air Conditioning’ sub-category, the most utilized substances are HFC-125, HFC-134a, HFC-143a, HFC-32, and HFC-23. For mobile air conditioning, HFC-134a is the sole substance used. The Metal Industry, particularly iron and steel production, accounted for 6.2% of the IPPU sector's emissions in 2022, with a 62% increase in emissions from this subsector, rising from 19.6 Gg CO2e to 31.6 Gg CO2e. Additionally, emissions from the use of lubricants as non-energy products in the industrial sector represented 1% of the IPPU sector’s total emissions. | ||
GHG trends in IPPU sector in RoM from 2000 to 2022 (by GHG)This graph depicts the trend in emissions from industrial processes from 2005 onwards, detailing CO2 and HFC (Hydrofluorocarbons) emissions along with the total combined emissions: CO2 Emissions (blue line): These remain relatively stable and low throughout the period, indicating that CO2 emissions from industrial processes have not significantly increased. HFC Emissions (red line): This shows a more dynamic pattern, with a notable increase starting around 2010, surpassing CO2 emissions by a considerable margin in subsequent years. Total Emissions (green line): Reflecting the combined effect of both CO2 and HFC emissions, this line reveals a steady upward trend from 2010 onwards, largely driven by the rise in HFC emissions. The graph illustrates a significant concern regarding the increase in HFC emissions, which are potent greenhouse gases, emphasizing the need for targeted measures to control and reduce these emissions in industrial processes. | ||