GHG Emissions from the Waste Sector


Waste (IPCC Sector 4)

This includes emissions from waste management practices such as solid waste disposal, wastewater treatment, and incineration.

 
  • 4A - Solid Waste Disposal on Land

    • 4A1 - Managed Waste Disposal Sites - Emissions from landfill sites that are managed and have some degree of control over gas emissions.
    • 4A2 - Unmanaged Waste Disposal Sites - Emissions from open dumps and other disposal sites without specific gas recovery or control systems.
    • 4A3 - Uncategorised Waste Disposal Sites
  • 4B - Biological Treatment of Solid Waste

    • 4B1 - Composting - Emissions from the biological decomposition of organic waste under controlled aerobic conditions.
    • 4B2 - Anaerobic Digestion at Biogas Facilities - Methane emissions captured from the anaerobic decomposition of organic waste.
    • 4B3 - Open Windrow Composting - Emissions from the aerobic decomposition of organic waste in open conditions.
    • 4B4 - Mechanical Biological Treatment - Emissions from waste treatment processes that combine mechanical and biological treatment methods.
  • 4C - Incineration and Open Burning of Waste

    • 4C1 - Incineration of Waste - Emissions from the combustion of waste materials in incineration facilities, including CO2, methane, nitrous oxide, and possibly other pollutants.
    • 4C2 - Open Burning of Waste - Emissions from the uncontrolled burning of waste materials outside of formal incineration facilities.
  • 4D - Wastewater Treatment and Discharge

    • 4D1 - Domestic Wastewater - Emissions from the treatment and discharge of wastewater from residential sources, including methane and nitrous oxide from anaerobic decomposition processes.
    • 4D2 - Industrial Wastewater - Emissions from the treatment and discharge of wastewater from industrial sources, which can vary widely depending on the type of industry and the specific processes involved.
    • 4E - Other (please specify)

In the waste sector, GHG emissions are primarily estimated from solid waste disposal (4.A), which is the major emissions category. Subsectors like biological treatment of solid waste (4.B) and incineration (4.C), with energy-related waste incineration covered under the energy sector, also contribute significantly to emissions. Wastewater treatment and discharge (4.D), involving domestic, commercial, and industrial sources, typically represents the second largest source of emissions within this sector. The scope of waste covered in this sector aligns with the definitions provided in the 2006 IPCC Guidelines.

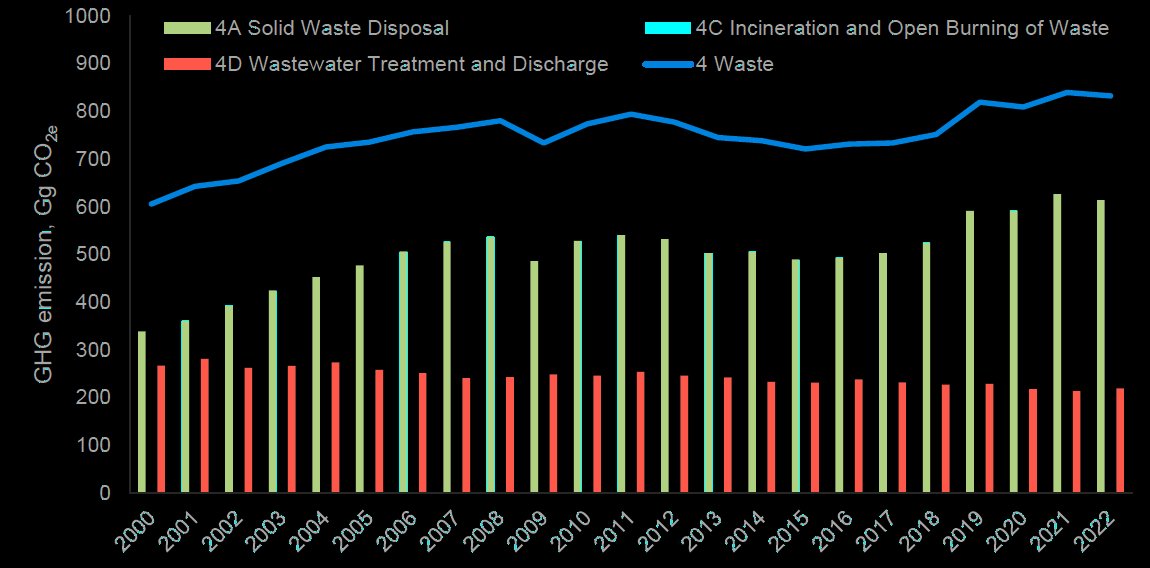
GHG emission trend of Waste sector of RoM from 2000 to 2022. source: BTR/NID 2024

The Waste sector in Mauritius is an important source of greenhouse gas emissions, primarily through the decomposition of organic materials in landfills, which generates methane, a potent greenhouse gas.

Solid waste disposal sites, particularly those that manage municipal and industrial waste, are the main contributors to these emissions. As organic waste decomposes anaerobically in landfills, it produces methane, which can escape into the atmosphere if not properly managed through landfill gas capture systems. In addition to landfill emissions, the biological treatment of solid waste, including composting and anaerobic digestion, can also produce greenhouse gases, though these methods are generally considered more sustainable when managed correctly. Waste incineration, while reducing the volume of waste, emits carbon dioxide and other pollutants, depending on the composition of the waste being burned.

Wastewater treatment and discharge is another critical component of the Waste sector, where methane and nitrous oxide emissions arise from the treatment processes used in sewage and industrial effluents. The efficiency and technology employed in wastewater treatment plants can significantly influence the level of emissions.

Efforts to mitigate emissions from the Waste sector include improving waste management practices, increasing recycling rates, enhancing composting and anaerobic digestion technologies, and upgrading wastewater treatment facilities to reduce methane and nitrous oxide emissions. These strategies not only help in reducing the sector's greenhouse gas footprint but also contribute to broader environmental sustainability goals in Mauritius.

GHG emissions from the Waste Sector in Mauritius increased by 37.4% from 2000 to 2022, rising from 605 GgCO2e to 832 GgCO2e. In 2022, the most significant source of emissions within this sector was the solid waste disposal category, accounting for 73.7% of the sector’s total emissions. The second major contributor was wastewater treatment and discharge, which represented 26.2% of the sector's emissions. However, emissions from this category decreased by 18%, from 266.4 GgCO2e in 2000 to 218 GgCO2e in 2022.

From 2017 to 2022, there were no emissions from the biological treatment of solid waste due to non-operational equipment. Incineration accounted for only 0.01% of the waste sector's emissions in 2022. The GHG emission trends for Mauritius's waste sector from 2000 to 2022.

CO2eq Emissions of the Waste sector - Main Components

The graph illustrates greenhouse gas (GHG) emissions from the waste sector in Mauritius, as from 2000. 

Key Observations:
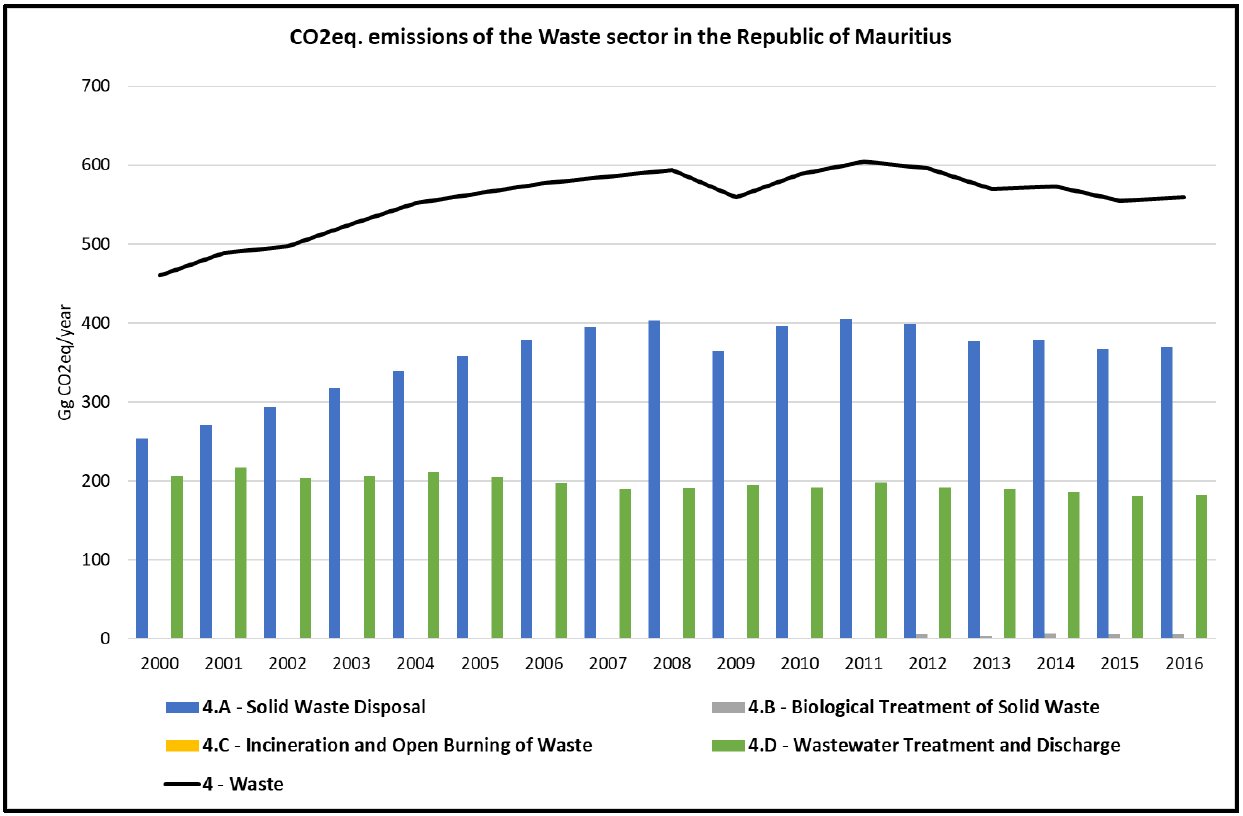
  • Overall Trend (Total Emissions Line)
    • The total emissions from the Waste sector have shown an increasing trend over the period. The line graph indicates that emissions have risen from just over 450 Gg CO2eq/year in 2000 to nearly 550-600 Gg CO2eq/year by 2016. This rise suggests increasing waste generation or changes in waste management practices that may be less effective at controlling emissions.

    •  
  • Solid Waste Disposal (4A - Blue Bars)
    • This category constitutes the largest source of emissions within the Waste sector throughout the period observed. The emissions have shown a general increase, indicating potentially growing volumes of solid waste disposal or changes in the composition of waste that lead to higher methane generation.
  • Biological Treatment of Solid Waste (4B - Light Green Bars)
    • Representing emissions from biological treatment methods like composting or anaerobic digestion, these emissions are significantly lower compared to 4A and 4D. The trend is relatively stable but exhibits slight fluctuations, indicating variable efficiency or capacity utilization in biological treatment processes over the years.
  • Incineration and Open Burning of Waste (4C - Yellow Bars)
    • Data for this category is not visible in the graph due to its relatively minor role suggesting limited use of incineration or open burning as waste treatment methods in Mauritius, or very low emissions associated with these practices.
  • Wastewater Treatment and Discharge (4D - Dark Green Bars)
    • The emissions from wastewater treatment and discharge are consistently higher than those from biological treatment but lower than solid waste disposal. The trend in these emissions shows gradual increases over the years, suggesting potential increases in wastewater volumes or changes in treatment efficacy.
 

source: BUR1, 2021

  • Implications

  • Need for Improved Waste Management: The increasing overall trend and the significant emissions from solid waste disposal underscore the need for Mauritius to explore enhanced waste management strategies, such as recycling, waste reduction initiatives, and improved landfill gas capture technologies.
  • Potential in Biological Treatment: The comparatively lower emissions from biological treatment suggest that expanding these practices could be beneficial, particularly if combined with advancements in technology to make these processes more efficient and scalable.
  • Monitoring Wastewater Treatment: The rising emissions from wastewater treatment call for a review of current practices, potentially integrating more advanced treatment solutions to handle increasing loads or to improve the treatment efficiency.
  

Source Description

4A & 4B - Solid Waste sector  

The amount of solid wastes generated in Mauritius was over 425,000 tonnes in 2016. Most of the solid  wastes are landfilled and a few of them have started to be composted as from 2012. LFG, produced in  the landfill, are currently captured for electricity production. Recycling is carried out only at small  scales.  


Facts 

  • Population (2015): ~1.26 million
  • Domestic waste landfilled (2016): 428,032 tonnes
  • Total waste landfilled (2016): 444,695 tonnes

4C -  Incineration and Open Burning of Waste


4D - Liquid Waste sector

The amount of liquid wastes generated in Mauritius is increasing and in 2015 the treated wastewater reached 49.37 million m3 (Statistics Mauritius 2016) with an annual growth of ~5.6%. In 2014, the Government investment was around MUR 15 billion in the wastewater sector for the construction of wastewater treatment plants, pumping stations, trunk and street sewers and reticulation networks. For the coming years, investment in respect of wastewater infrastructure is expected to be around MUR 5.4 billion (WMA 2017).
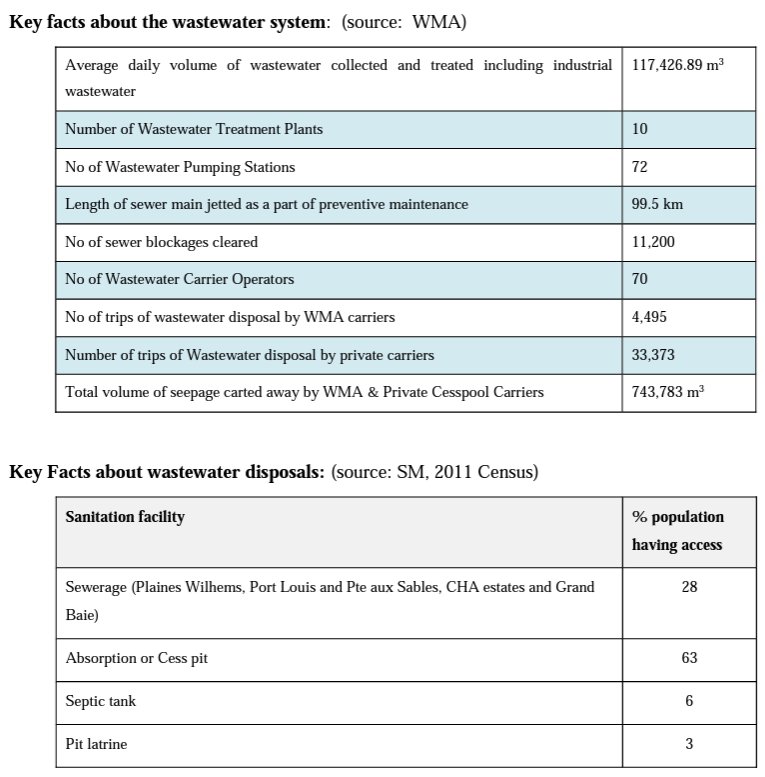