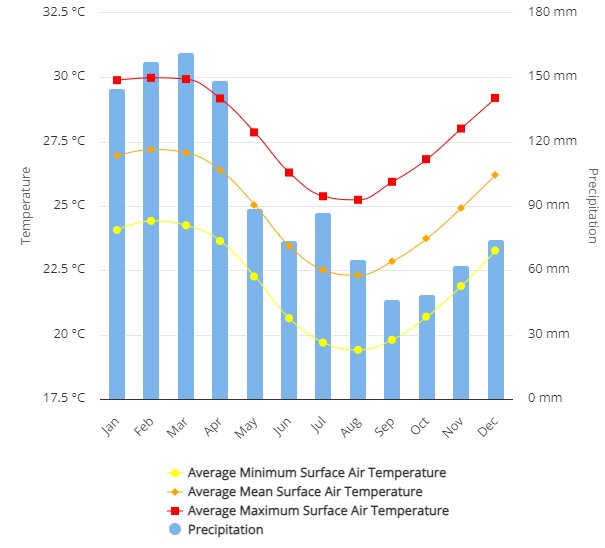
This chart provides a clear depiction of the climate trends on Saint Brandon, presenting both temperature and precipitation data across the months:
Temperature Details:
Average Minimum Surface Air Temperature (represented by blue squares): This line shows the monthly lowest average temperatures, beginning high at nearly 30°C in January, gradually decreasing to around 22.5°C by July, and then rising again towards the end of the year.
Average Mean Surface Air Temperature (indicated by red squares): This tracks the overall average temperatures monthly, peaking around 32.5°C in February and dropping to about 27.5°C in August.
Average Maximum Surface Air Temperature (illustrated with yellow dots): This marks the highest average temperatures for each month, following a similar trend to the minimum temperatures but consistently registering higher throughout the year.
Precipitation (shown with blue bars):
Precipitation is highest in February, nearing 180 mm, and shows a significant decrease during the mid-year months, forming a dry season from May through October, where monthly precipitation falls below 60 mm.
The data indicates that Saint Brandon experiences a tropical climate characterized by a hot, humid season at the beginning of the year and a cooler, drier period in the middle months. The precipitation pattern might suggest influences from seasonal monsoonal changes, common in oceanic island environments. Understanding these patterns is essential for activities such as agriculture, fishing, and tourism planning in Saint Brandon Islands.
Projections:
For the projections, please contact the Mauritius Meteorological Services.