
This chart illustrates the climatology of Agalega Island, detailing both temperature and precipitation trends across the year: Temperature Data: Average Minimum Surface Air Temperature (depicted by blue squares): This line represents the lowest average temperatures for each month, which decrease from around 30°C in January to about 22.5°C by July, and then gradually increase towards the end of the year. Precipitation (illustrated by blue bars): The precipitation pattern shows higher rainfall at the beginning and end of the year, with a peak in February (near 180 mm) and a distinct dry period from May through October, where precipitation is considerably lower (below 60 mm in most of those months). Agalega Island therefore experiences a tropical climate with a pronounced warm season at the beginning of the year and a cooler, drier period mid-year. The precipitation pattern suggests a season influenced possibly by monsoonal winds, common in many island climates in the region. This chart is useful for understanding seasonal variations in weather which can affect everything from agriculture to tourism on Agalega Island.
Projections: For the projections, please contact the Mauritius Meteorological Services. | 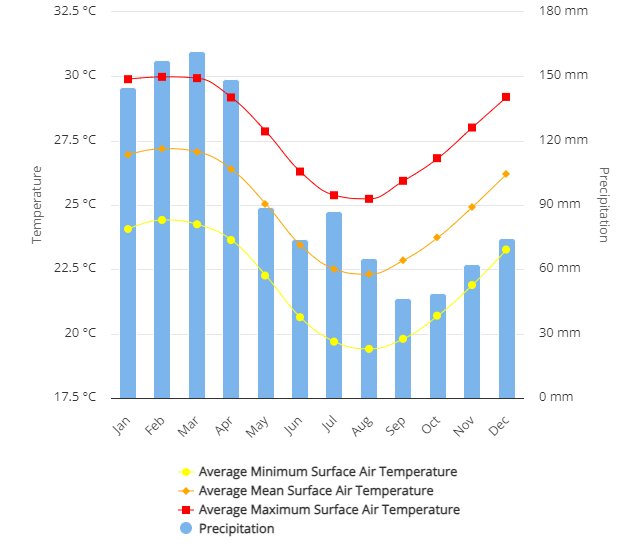 |