
Rainfall & Rainfall Trends
Mauritius experiences a subtropical climate characterized by distinct wet and dry seasons. This climate pattern brings a substantial amount of rainfall to the island; rain is a valuable natural resource. Rainfall patterns primarily influence the country's surface water and groundwater. Mauritius, covering an area of 1865 km², receives an average annual rainfall of about 1993 mm, totaling approximately 3700 Mm³ of water. Rodrigues, , covering an area of 108 km², receives an average annual rainfall of about 1100 mm. Both islands have a significant (>60%) of their rainfall occurring during the summer months from December to April, aligning with the cyclonic season. Rainfall events exceeding 300 mm can be anticipated at least once due to cyclones in the Indian Ocean. The rainfall distribution across Mauritius varies dramatically due to its topography, ranging from 1400 mm on the eastern coast to 4000 mm on the Central Plateau and as low as 600 mm on the western coast. The rainfall is monitored at some 200 stations and a few stations that continuously record the intensity and duration of rainfall. These measurements highlight the diverse and complex rainfall patterns on the island. Between 1960 and 2006, OND (October-November-December) rainfall in the country declined at an average rate of 8.7% per decade (ALM 2009). Reduced rainfall and drought pose serious threats to water availability in Mauritius. The Mauritius Meteorological Services forecast indicates that in the coming years, the southern Indian Ocean region can expect rising temperatures, sea levels, and intensified tropical cyclones. Additionally, there is projected to be a decrease in annual rainfall alongside an increase in heavy precipitation events, prolonged dry spells, and occurrences of tidal surges (RoM 2016). | 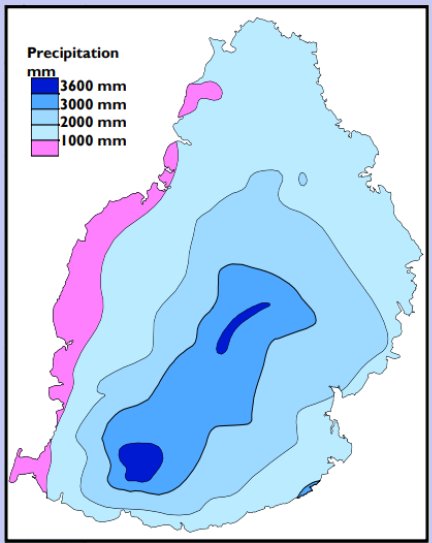
|