Climate Zone: Mauritius: Af; Am
Mauritius enjoys a mild tropical maritime climate throughout the year. The country has two seasons: a warm humid summer extending from November to April and a relatively cool dry winter from June to September. The month of October and May are commonly known as the transition months.
The warmest months are January and February with average day maximum temperature reaching 30.0 ºC and the coolest months are July and August when average night minimum temperatures drop down to 17.3 ºC.
Long term mean annual rainfall (1991-2020) over the Island is 2019 mm.
The wettest months are February and March.
The driest month is October.
Mean summer rainfall (1991-2020) is 1352 mm, which is 67% of the annual amount over the Island.
Mean winter rainfall (1991-2020) is 668 mm.
Current and Historical Climate Data | ||
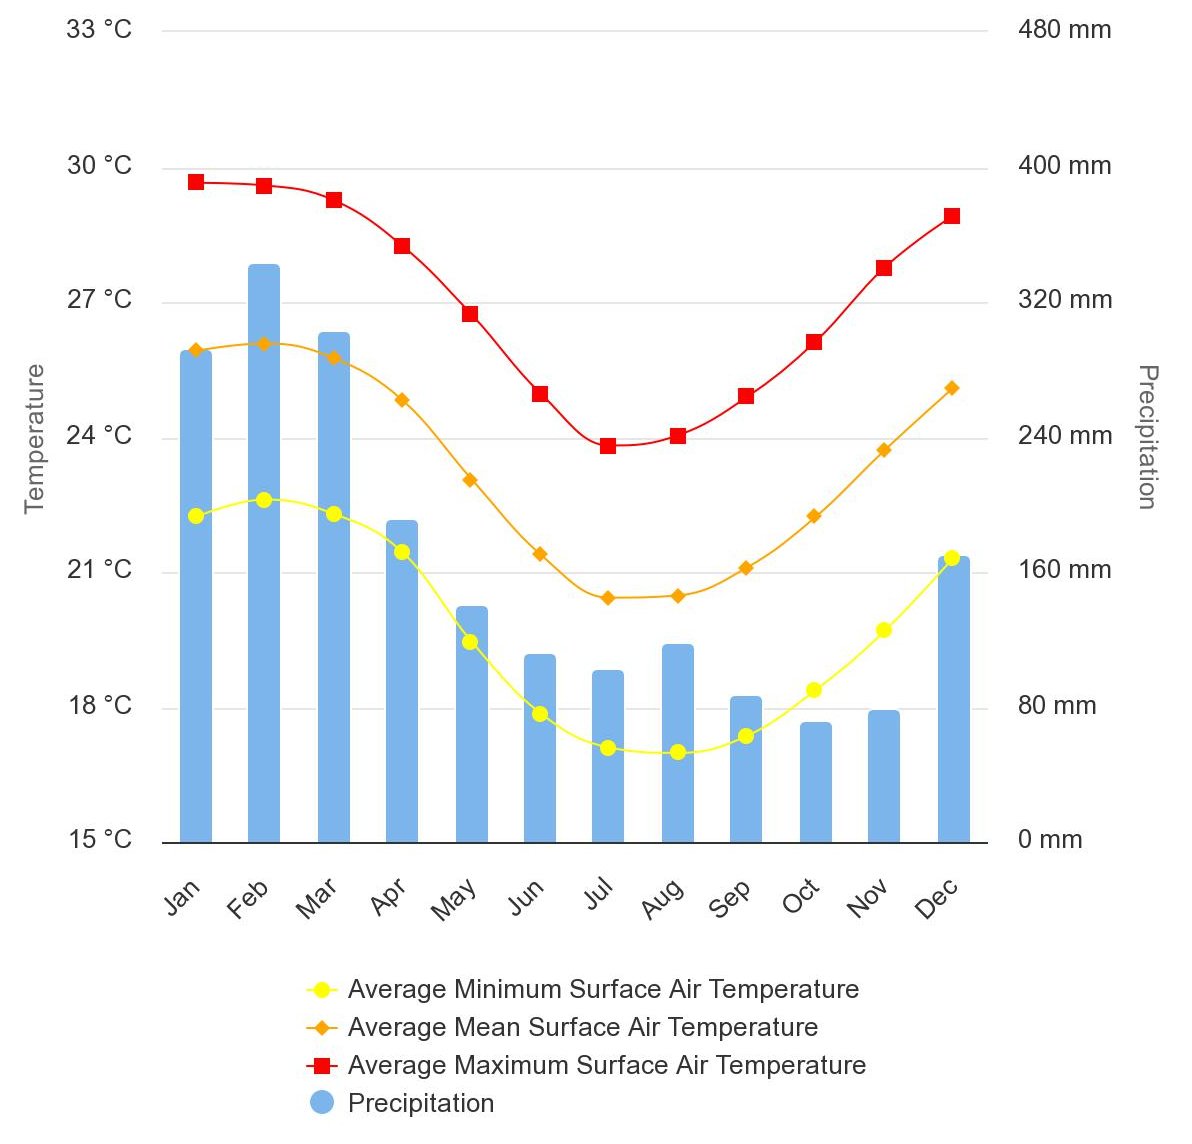
Typical Temperature and Precipitation | ||
The chart below illustrates the climatology of Mauritius, showing variations in temperature and precipitation throughout the year. The climate profile depicted in the chart is typical of a tropical environment with a clear wet season and a pronounced dry season. The temperature remains relatively stable and warm throughout the year, supporting a variety of ecological and agricultural activities. The high precipitation in the early months can be critical for water resources, while the dry season may require strategic water management and conservation efforts. This pattern is essential for planning in agriculture, tourism, and infrastructure development in Mauritius. | ||
Rainfall
|  | |
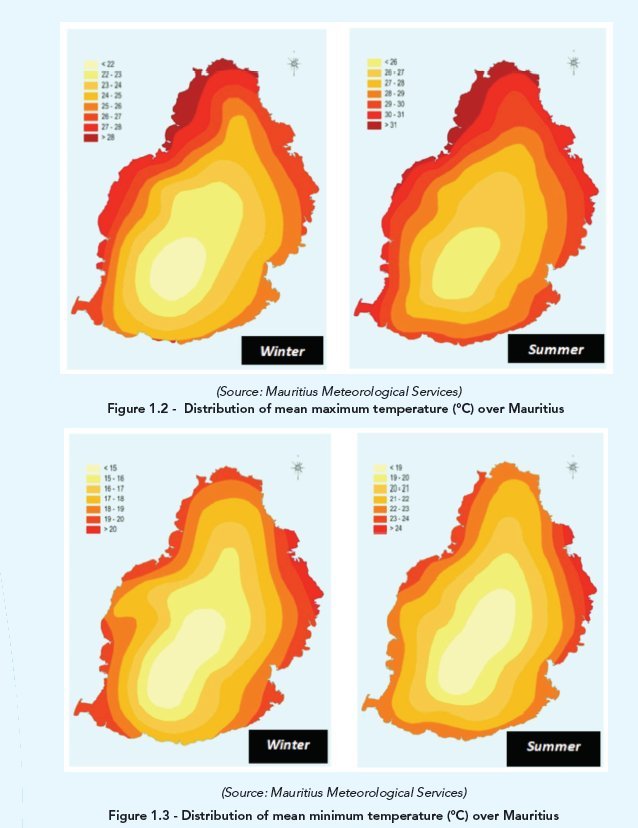
Temperature Distribution | ||
| The figures illustrate the distribution of mean maximum and mean minimum temperatures across Mauritius during winter and summer seasons. | ||
Mean Maximum Temperature Distribution: During the winter, the distribution shows cooler temperatures towards the central parts of the island, where temperatures are below 22°C. The coastal areas experience warmer temperatures, generally between 26°C to 28°C. This indicates a temperature gradient influenced by elevation and proximity to the sea.
The mean minimum temperatures in winter indicate a cooler central region, with temperatures ranging from 15°C to 18°C, and warmer coastal areas, with temperatures generally between 18°C to 20°C. The coldest areas are centrally located, likely influenced by higher altitudes. These temperature distributions emphasize the thermal variation between the central and coastal regions of Mauritius, influenced by altitude and sea proximity. The central highlands are consistently cooler, a common feature in island climates with varied topography. This data is crucial for understanding climatic variations within the island, which can impact agricultural planning, tourism, and habitat distribution. The clear seasonal differences also underline the need for adaptive strategies in various sectors to manage the summer heat and cooler winter conditions, particularly in more temperature-sensitive activities. |
 | |
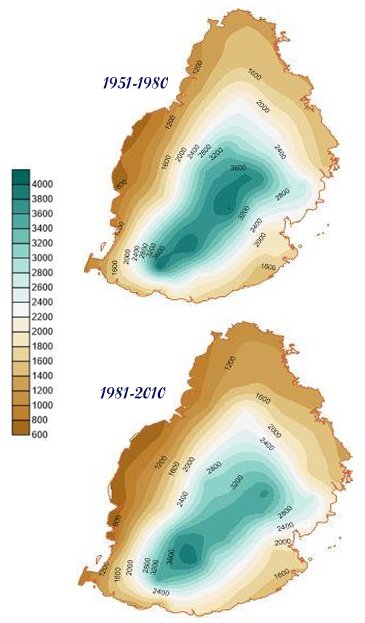
Rainfall Distribution | ||
The figures display the long-term annual rainfall distribution over Mauritius for two distinct periods: 1951-1980 and 1981-2010. These maps offer a clear visualization of how rainfall patterns have evolved over time across different regions of the island. | ||
Implications: These changes in rainfall patterns could have significant implications for water resource management, agriculture, and flood risk management in Mauritius. Increased rainfall in the central regions might enhance water availability but also increase the risk of floods and landslides. Conversely, the slight increase in coastal rainfall could benefit coastal agriculture but might also necessitate adjustments in urban drainage and flood prevention strategies. Data from these maps is crucial for planning and adapting to changing rainfall patterns, ensuring sustainable development and disaster risk management in Mauritius. |
 | |
Changing Temperature Patterns | ||
Climate records over the period 1951-2014 show a significant warming trend of about 1.2 °C in Mauritius. Analysis of temperature records indicate that the observed rate of temperature change is on average 0.020°C/yr for Mauritius for the period 1951-2014. Over the period 1961 to 2014, the mean maximum temperature has increased by 0.023 °C and the mean minimum temperature by 0.016 °C (TNC, 2016) . For projection - see below. | 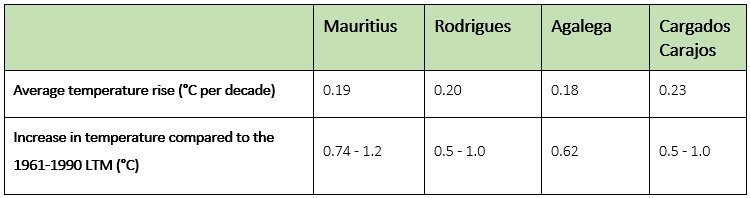 source: MMS 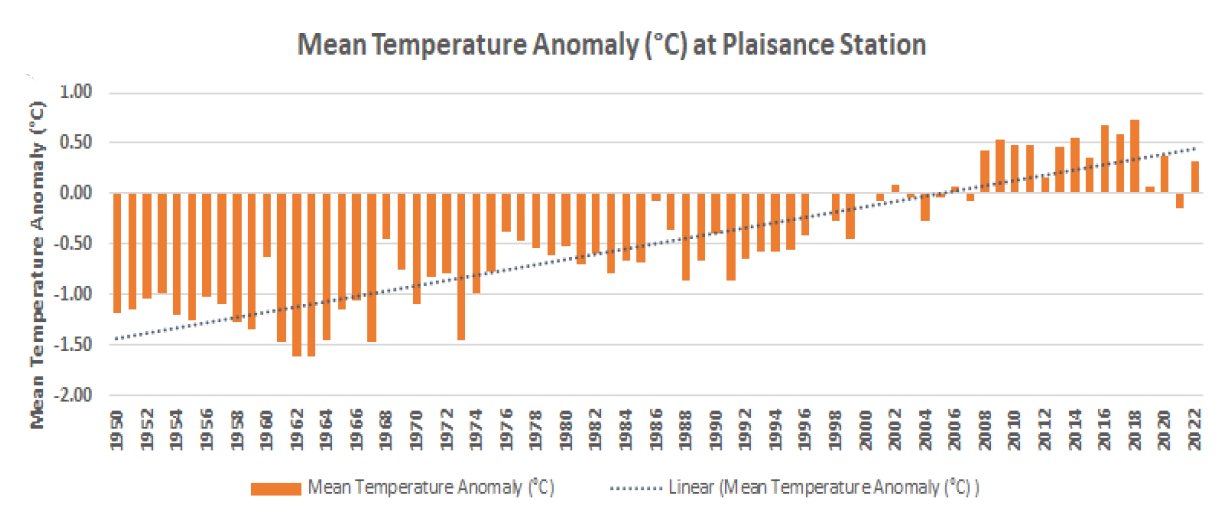 source: BTR1, 2024 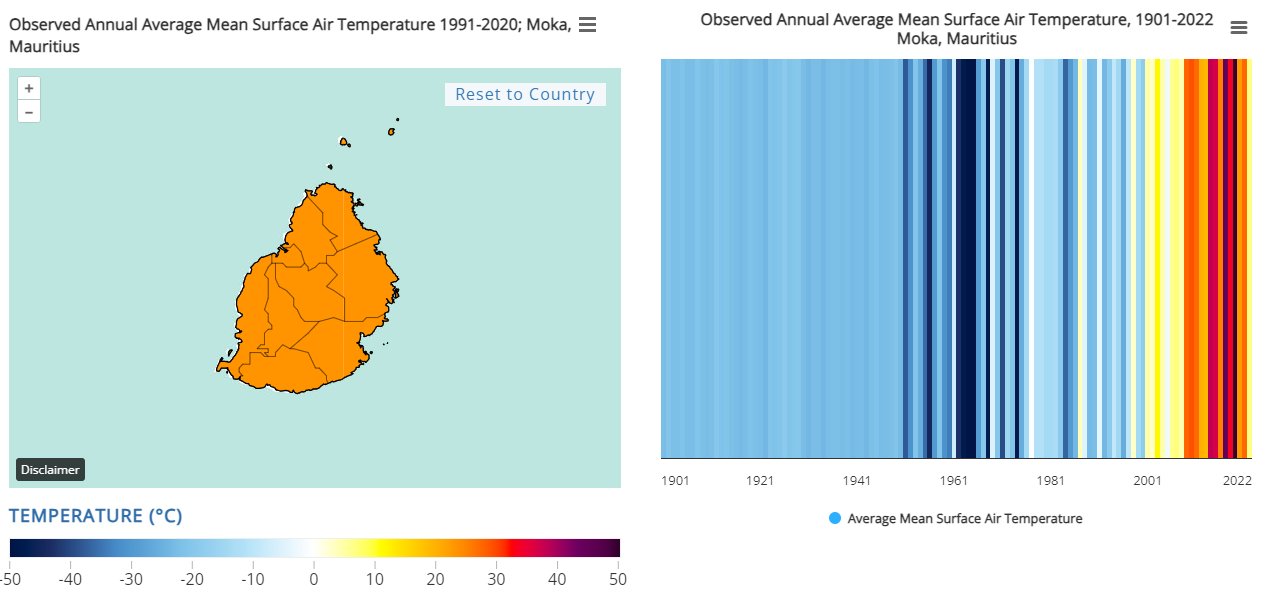 | |
Changing Rainfall Patterns | ||
The graph displays the trend of annual rainfall in mm over a century-plus timeframe, from around 1900 to 2015.
The graph illustrates the complexity of rainfall patterns and the importance of long-term data in understanding climatic trends. The slight downward trend in annual rainfall, as shown by the linear trend line, while not steep, warrants monitoring given the potential implications for water resources and environmental management in the region. This data is invaluable for planning and adaptation strategies in response to potential climatic shifts. For projection - see below. | 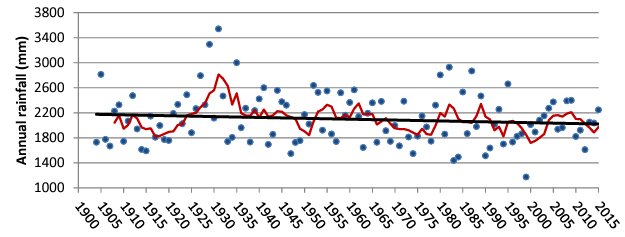 The blue dots represent individual annual rainfall measurements. The red line is the moving average, smoothing out the yearly fluctuations to provide a clearer view of the underlying trend. The black line represents a linear trend across the entire data set.
| |
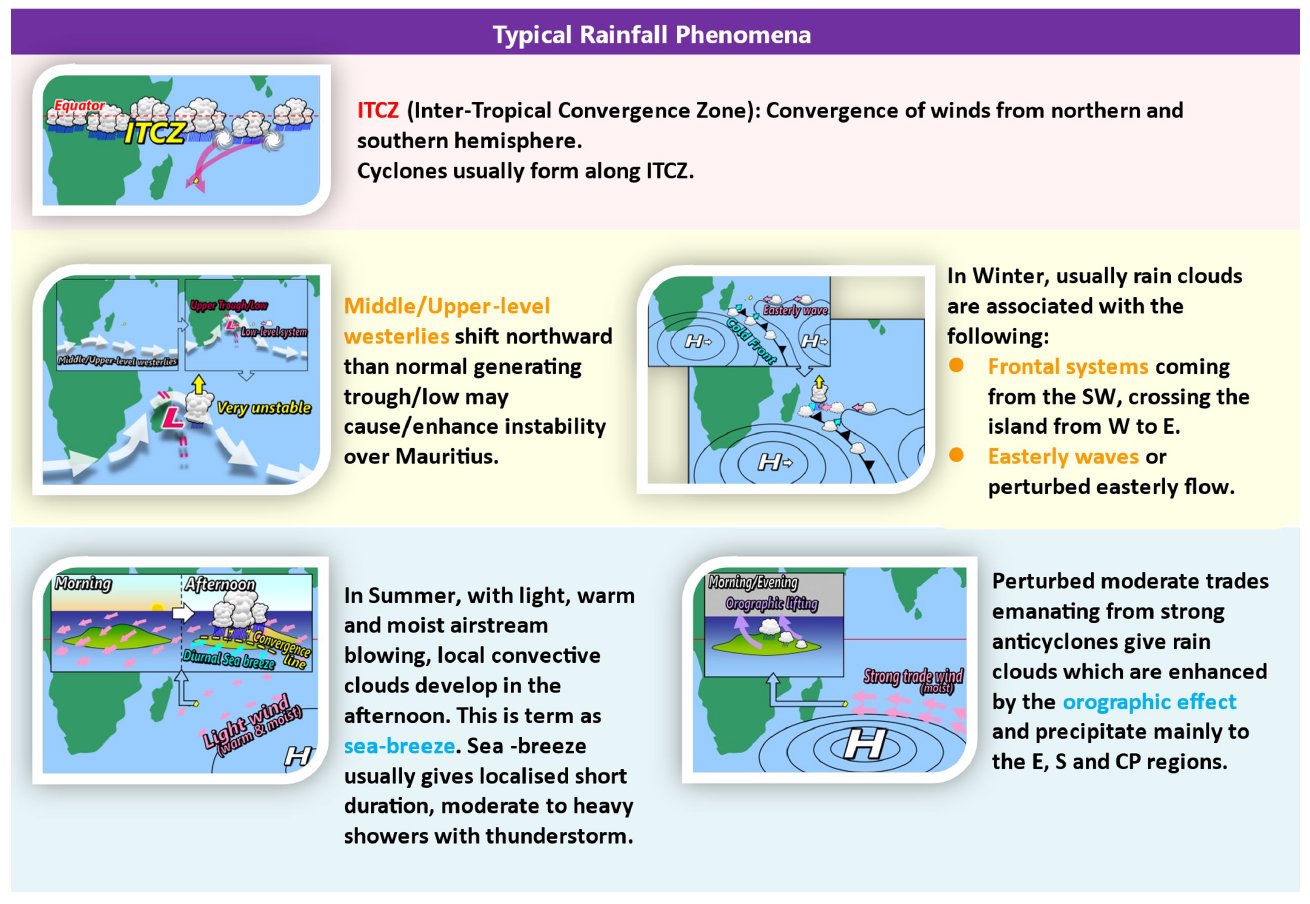
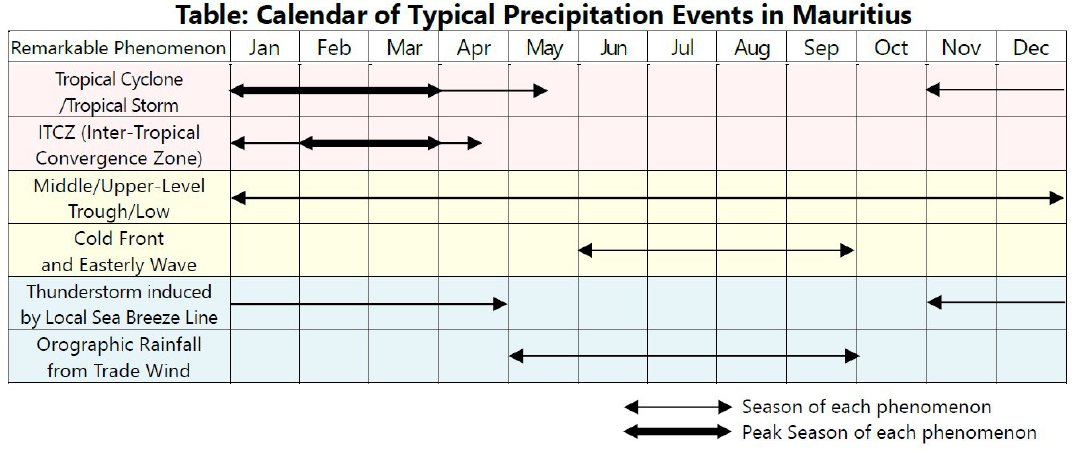
Typical Rainfall Phenomena and Events in Mauritius | ||
This table visually represents the occurrence and intensity of various meteorological phenomena throughout the year in Mauritius, including:
|   | |
Daylight & Sunshine | ||
Sun Path and Sunset Duration The Sun's path and a location's distance from the equator not only affect sunrise and sunset times but also change the duration of sunset. Near the equator, sunsets typically last about 20 minutes. However, Mauritius, situated at 20 degrees S latitude, sunset durations are longer, averaging 26 minutes—25 minutes in June and 26 minutes in December. Astronomical Day Length and Sunshine Duration The length of the day from sunrise to sunset, known as the astronomical day length, is constant and independent of visible Sun conditions. Factors like cloud cover and physical obstructions can affect how much sunlight actually reaches the ground. In Port Louis, the sunshine duration varies; for instance, in June, there is about 7:06 hours of sunlight during a 10:57-hour day, indicating about 3:51 hours of obstruction. In December, sunlight lasts for 5:47 hours of a 13:23-hour day. Sun Position Throughout the Year Mauritius, at 20 degrees south latitude, sees the Sun cross directly overhead twice annually—on January 21st and November 22nd. During this period, the Sun moves from being north of the island to south. Due to its tropical location, the Sun is high in the sky at midday, providing intense sunlight. Notably, during the winter solstice on June 21st, the Sun is at its lowest midday position, reaching only 46.4 degrees above the northern horizon. |  Average length of day https://www.worlddata.info/  Actual hours of sunshine https://www.worlddata.info/ | |
Humidity | ||
Mauritius, with its tropical climate, typically experiences high humidity levels throughout the year, which is characteristic of oceanic islands in such climatic zones. General Humidity Conditions
Regional Variations
Impact of Humidity
Adaptation Strategies
| Humidity is a constant feature of the Mauritian climate, influencing various aspects of daily life and economic activities on the island. Effective management and adaptation strategies are key to living comfortably and sustainably in such a humid environment. Relative humidity in %  
| |
Microclimates | ||
Mauritius, despite its small size, exhibits a variety of microclimates due to its diverse topography, which includes mountains, plateaus, and coastal plains. These microclimates significantly influence the island's weather patterns, affecting everything from agriculture to tourism. Overall, the microclimates of Mauritius add to its charm and complexity, offering a unique set of conditions that influence daily life, economic activities, and environmental policies on the island. Factors Influencing Microclimates
Implications of Microclimates
| The climatology for the western, northern, eastern, southern, and central regions of the island is detailed in the PDF documents provided below. The areas of Medine, Pamplemousses, Fuel, Plaisance, and Vacoas represent these five respective regions.
Key Microclimates in Mauritius
| |
Climate Extremes, Impacts & Projections | ||
Future Projections | ||
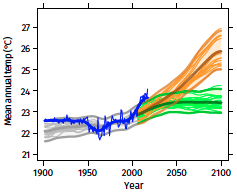
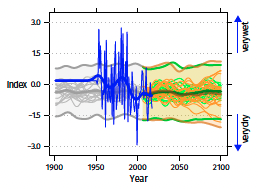
Projection - Mean annual temperature, 1900–2100 | ||
| .jpg) Temperature Projections for Mauritius for RCP 4.5 and RCP 8.5 (source: TNC, 2016)
source; ClimaHealth, WMO | |
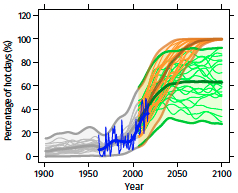
Projection - Percentage of hot days (‘heat stress’), 1900–2100 | ||
|
source; ClimaHealth, WMO | |
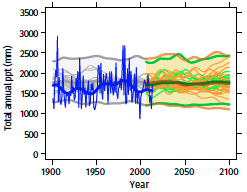
Projection - Total annual precipitation, 1900–2100 | ||
| .jpg) Precipitation Projection for Mauritius for RCP 4.5 and RCP 8.5 (source: TNC, 2016)
source; ClimaHealth, WMO | |
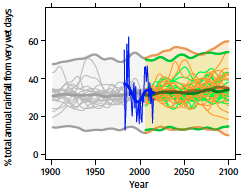
| ||
|
source; ClimaHealth, WMO | |
Projection - Standardized Precipitation Index (‘drought’), 1900–2100 | ||
The Standardized Precipitation Index (SPI) is a widely utilized index for measuring drought, assessing rainfall excesses or deficits over periods ranging from 1 to 36 months, with this discussion focusing on a 12-month period (SPI12). The index tracks how the frequency and/or intensity of extremely dry and wet conditions change relative to local averages. Projections suggest that SPI12 values will remain fairly stable, with an average around -0.4, indicating minimal changes in the frequency and/or intensity of both wet episodes and drought events. Despite this overall stability, year-to-year variability is expected to remain high, with both wet and dry periods of various intensities continuing into the future. |
source; ClimaHealth, WMO | |